Posted on 10 Comments

Hand Speed Index for Pickleball Paddles

John of Johnkew Pickleball reached out a while back for feedback on an idea to combine the static weight, balance point, and swingweight of pickleball paddles into a Hand Speed Index (HSI). Being an engineer, I noticed that the units didn’t work out in his proposed formula. Since it wasn’t based on physics, I was worried that it would be possible to “game” the number, but I liked the idea. After some thought and trying some not-so-great concepts, I had the idea to calculate the power required to maneuver a paddle through a certain motion in a given time. Paddles that require more power will be slower to maneuver, and vice-versa.

Just want the numbers? Go to the Hand Speed Index Calculator. Interested in the details? Read on.

I picked the motion of moving the paddle through 180°, from backhand to forehand (or vice-versa), while moving the hand a defined distance. The power requirement is calculated as two components: angular and linear.

The angular component of power is exerted as a torque that accelerates and decelerates the paddle in rotation. In the formula for the angular component of power below, RW is recoilweight in kg·m² , Θ is the angle of rotation in radians (180° is π radians), and t is the duration in seconds. The angle and duration are both halved, as the first half of the motion is acceleration and the second half is deceleration, but the power required for each phase is identical.

P_{a}=\frac{2RW(\Theta/2)^{2}}{(t/2)^{3}}

RW is a moment of inertia value similar to swingweight (SW) but about an axis through the center of mass. The formula below calculates RW from SW, mass (m), and balance point (BP). The units are kg·m², kg, and meters. These are not customary units for these values, but they make the power formula work out to Watts. The 0.05 m (5 cm) is the distance from the end of the handle to the SW axis.

RW=SW-(m(BP-(0.05\ m)))^{2}

The linear portion of the power is exerted as force that accelerates and decelerates the paddle center of mass laterally. If there were no force and just a torque was applied, the paddle would rotate about its center of mass. Just to keep the center of the hand stationary during the motion requires force. You can see this yourself by trying to flip a paddle from the forehand to backhand side as quickly as possible. Your hand will move opposite of the direction that the tip of the paddle moves unless you try to keep it stationary.

In the formula for the linear component of power below, m is the mass in kg, d is the distance that the hand moves in meters, BP is the balance point in meters, and t is the duration in seconds.

P_{l}=\frac{2m(d/2+BP-(0.05\ m))^{2}}{(t/2)^{3}}

I originally thought we’d pick a single hand move distance for the HSI, but the results are quite different at different distances. For short distances, adding mass at the bottom of the handle actually reduces the power requirement. The effect of the lowered balance point is greater than the effects of adding mass and swingweight. As the distance increases, mass becomes a larger factor, so the same mass at the bottom of the handle increases the power requirement. We settled on three distances to start, and the durations were selected to make the power requirements similar across the distances for a typical paddle. The actual power values aren’t necessarily meaningful, but the relative differences should be. I’m interested to hear if the relative differences match your subjective feel.


Per Harry’s comment below, I’m adding the derivation of the angular power formula. I’ve used basic equations from the AP Physics 1 Equation Sheet.

Here’s an equation for angular position (Θ):

\Theta=\Theta_{0}+\omega_{0}t+\frac{1}{2}\alpha t^{2}

The first two terms are zero. Solving for α, we get:

\alpha = \frac{2 \Theta}{t^{2}}

Then, an equation for angular velocity (ω) is:

\omega = \omega_{0} + \alpha t

The first term is zero, so substituting α from above, we get:

\omega = \frac{2 \Theta}{t}

An equation for kinetic energy (K) is:

K = \frac{1}{2} I \omega^{2}

Substituting ω from above, we get:

K = \frac{1}{2} I (\frac{2 \Theta}{t})^{2} = \frac{2 I \Theta^{2}}{t^{2}}

An equation for average power (Pavg) is:

P_{avg} = \frac{\Delta E}{\Delta t} = \frac{K}{t}

Substituting K from above, it becomes:

P_{avg} = \frac{2 I \Theta^{2}}{t^{3}}

This is the equation for angular power in the post above, where I is RW and both Θ and t are halved, as I explained there. Actually, I had originally omitted the “2” in the equation (fixed now). It was correct in the calculator, but I made an error when creating the equation for this post. The linear power equation can be derived similarly with the linear motion equations.

Posted on 2 Comments

Can Twistweight be Too High?

I was watching Episode 42 of the Pickleball Effect podcast while assembling SW1s today, and Braydon asked if it was possible for twistweight to be too high. He went on to mention that he felt that a high twistweight slowed down the acceleration of his backhand flick. I’m a bit surprised that he was able to notice it, but that is an expected effect of higher twistweight.

Consider mass added at the 4 and 8 o’clock positions of a paddle and reference the sketch below. The effect of that mass (m) on swingweight is m·a². For example, if adding 6 g (3 g per side), and a is 18 cm, then the swingweight will increase by (0.006 kg)·(18 cm)² = 1.944 kg·cm². The effect of that mass on twistweight is m·b², so if b is 9.5 cm, the twistweight will increase by (0.006 kg)·(9.5 cm)² = 0.542 kg·cm².

There is a third axis about which moment of inertia is interesting. This has conventionally been called spinweight, and it’s measured about an axis 90 degrees from the swingweight axis. In the sketch above, it would be about an axis coming out of the screen through the vertex a-c. It’s also the axis you’d get by installing a paddle into a swingweight machine with the paddle face parallel to the ground (more on that after the break). The effect of the added mass on spinweight is m·c². Length c is √(a² + b²) = 20.35 cm, so the added spinweight is (0.006 kg)·(20.35 cm)² = 2.485 kg·cm².

Note that the sum of the added swingweight and twistweight is equal to the added spinweight: 1.944 + 0.542 = 2.486 kg·cm². This will always be the case, assuming a paddle is approximately planar, and is described by the perpendicular axis theorem.

Back to Braydon’s backhand flick, there’s a large component of acceleration about the spinweight axis for this shot. Given two paddles, with everything equal except that one has a twistweight of 6.0 kg·cm² and the other has a twistweight of 7.0 kg·cm², the second paddle will have a spinweight that is 1.0 kg·cm² higher. The difference is there, but it’s small.


I wanted to add a bit more about measuring swingweight and spinweight in the real world. Theoretically, you could measure both swingweight and spinweight with the SW1. Practically, for paddles, the results are a bit misleading, as the effect of air resistance is very significant in the swingweight orientation. For example, my current main paddle has a swingweight of 114.3 kg·cm² and a twistweight of 7.5 kg·cm², but the spinweight measures 117.7 kg·cm². That’s lower than the expected result of 114.3 + 7.5 = 121.8 kg·cm², but that’s because the swingweight measurement is inflated due to the effect of air resistance. To minimize the effect of air resistance on swingweight, you could measure spinweight and subtract twistweight. In my case, that gives a result of 110.2 kg·cm². Of course, that’s only useful if comparing to paddles measured similarly.

If you’re interested, I have a bit more about the relationship between swingweight, twistweight, and spinweight for tennis racquets in the post Racket Twistweight from Spinweight and Swingweight.

Posted on Leave a comment

New SW1 App Features in Open Beta

I recently improved the calibration process in the Briffidi SW1 app. I also added saved tare values to make switching between adapters easier. These features are available to try now in open beta versions of the apps. Install the appropriate app by following one of these links: iPhone Open Beta or Android Open Beta.

Calibration Process

The calibration process for the Briffidi SW1 is confusing to many users. It’s unintuitive and was heavily influenced by the required app development effort. In my defense, I didn’t know if I’d sell many SW1s, and there were many other things to do to release a product. It worked.

Recently, I spent some time figuring out a more intuitive calibration process. Instead of creating measurement groups and taking specific measurements in each group, the calibration measurements are taken directly from the Calibrate tab in the app. There are sections for each configuration of the calibration rod, and each section incudes a dedicated Measure button and a dedicated measurement group.

When there is at least one measurement in each calibration group (I recommend at least two measurements of each), the Calibrate button will become active. After the Calibrate button is tapped, the Calibration Results below will update, and a confirmation will be displayed. If the calibration results are outside of normal ranges, the confirmation will indicate that, the abnormal result will be highlighted in red, and possible solutions will be displayed below. For example, users commonly extend only three of the four internal sections of the extendable calibration rod. When this happens, the Spring Constant result will be abnormally high. The results and confirmation display as shown below.

Things to check are displayed below the results.

Saved Tare Values

As I used the SW1 more with the twistweight and pickleball adapters, I often found myself forgetting to tare out the adapter before mounting a racquet or paddle. To make this process easier, the three latest Tare values are available for recall. When switching back to an adapter you’ve previously tared-out, long-press the Tare button to select the appropriate tare value. Note that the saved tare values are cleared during calibration.

Additionally, it wasn’t always clear that the Tare function was active. Now, when active, in addition to the button being filled in blue, the button text will indicate the value being subtracted from the measurement result.

Feedback Requested

If you try out a beta app and have any problems or suggestions for further improvement, please let me know in an email to support@briffidi.com.

Posted on 1 Comment

How Does the Joola “Propulsion Core” Work?

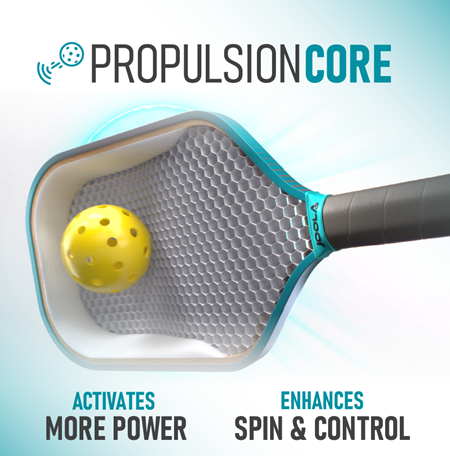
How does the Joola “Propulsion Core” design, with a strip of soft foam around the top/sides, work to increase pop/power?

Since I find it interesting, I thought I’d write a bit about my hypothesis. I have a mechanical engineering degree, but I never took any vibration courses. I probably had some basic introduction, but mostly, I’ve just picked things up from reading papers about coefficient of restitution and the like. I’m far from an expert in this area, and I’d be grateful for feedback from those with more knowledge.

First, a paddle has a first bending mode (FBM) that is similar to that of a free-free beam. The animation below shows the FBM of a simulated, typical paddle. The brightly colored areas indicate the nodes, or places where displacement is minimal, of this vibration mode. You can find these nodes on a paddle by holding the paddle loosely between your thumb and forefinger at approximately the node on the handle. Let the paddle hang vertically and tap up and down the face. The paddle will vibrate more or less, depending on where you strike it. The vibration will be minimal at the node.

The FBM node is a “sweet spot” and, based on my reading about tennis racquets, the most important “sweet spot”. When a ball is struck at the node, no energy is converted into vibration of the FBM, so more energy is returned to the ball. The vibration of the FBM is easy to feel, so a player will naturally attempt to hit the node.

The FBM is too “slow” to return energy to the ball. If a ball is struck between the nodes, you might expect the paddle to act like a trampoline and provide extra energy to the ball as it vibrates back into the ball. It won’t happen, though, as the ball has already left the paddle before it cycles back.

There are vibrations modes that are sufficiently “fast” to return energy to the ball. There is a membrane mode of the paddle face that is approximately centered on the paddle face, as shown in the animation below. The frequency of this membrane mode is probably the most important value for the “trampoline effect” of a paddle. I don’t yet have any data to back this up, but I suspect that on thicker (16+ mm) paddles, the frequency is higher than optimal for energy return, and it becomes more optimal as the thickness, and thus frequency, decrease.

So, how does the foam around the top and sides of the Joola “Propulsion Core” create more power?

In the vibration animations above, notice that the location of the FBM node is higher up the paddle face than the center of the membrane mode. As a result, if you hit the FBM node, you avoid energy loss to FBM vibration, but you don’t get the full benefit of the membrane mode. If you hit the center of the membrane mode, you get the full effect of that mode, but you lose some energy to FBM vibration. What if the two were aligned? I think that’s what the soft foam of the propulsion core achieves. Because the rigid honeycomb portion of the core is shorter, the FBM node will shift down the paddle face and be better aligned with the center of the membrane mode. The new, better-aligned “sweet spot” will also be closer to the paddle center of gravity than a typical “sweet spot” would be, resulting in a higher effective mass for the collision. The result of all that is more energy returned to the ball.

Is that all good news? I’m not sure. When the FBM node and the center of the membrane mode are misaligned, it elongates the area where energy returned is approximately equal. That misalignment may be better for consistency, as if you play anything like I do, you don’t hit the same spot on the paddle every time.

What do you think? I’ve not touched one of these paddles yet. If you have one, does the FBM node seem lower on the paddle face than on a typical paddle? Does it feel like the power falls off more quickly than a typical paddle if you hit near the tip of the paddle? I’d expect it to.

Posted on Leave a comment

Replicating My Racquet Handle on a Paddle

I’ve been playing a good bit of pickleball lately, in addition to tennis, and the paddle handles I’ve used aren’t really to my liking. My main tennis racquets are customized Head Gravity Lites with 3D-printed pallets, and I wanted to try replicating that handle on a paddle. I bought a cheap, raw carbon fiber faced paddle (Hisk Rav Pro) to tear apart.

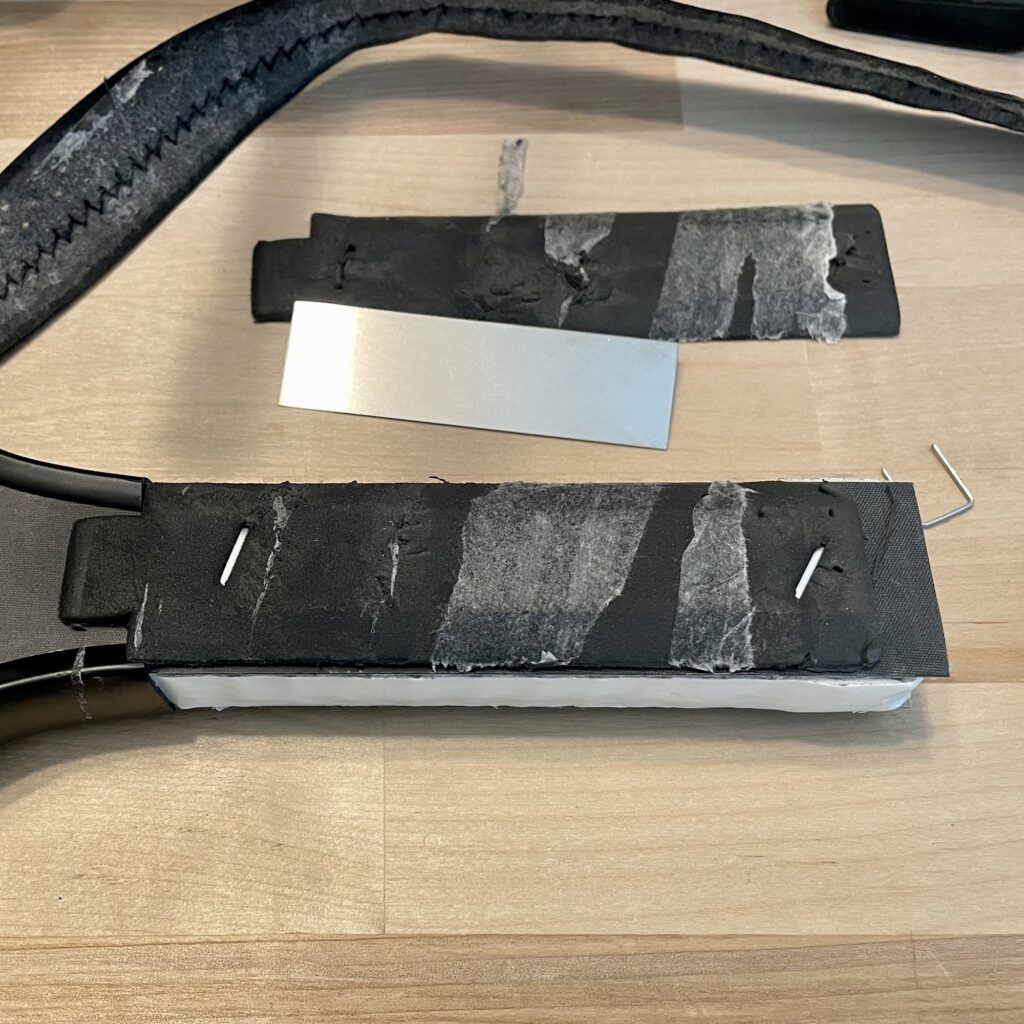
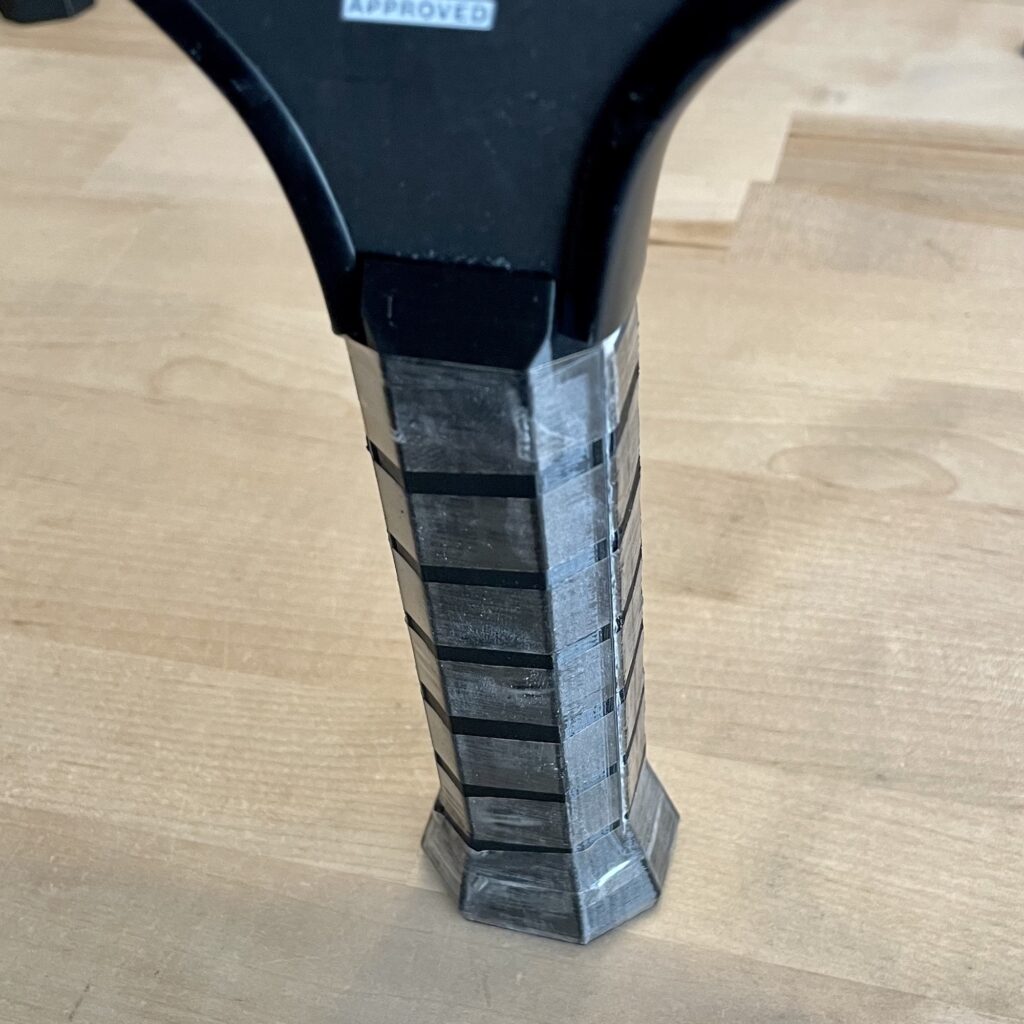
The paddle handle is simply cut from the laminate of face and core materials. Foam pieces are stapled on either side, and there are a couple thin steel sheets under the foam for added weight (9 g for both). A flared butt cap is stapled onto the end. There is foam tape applied all along the edge of the paddle. The resulting handle is pretty squishy, and it lacks the well-defined, octagonal bevels that I’m used to from tennis racquets.

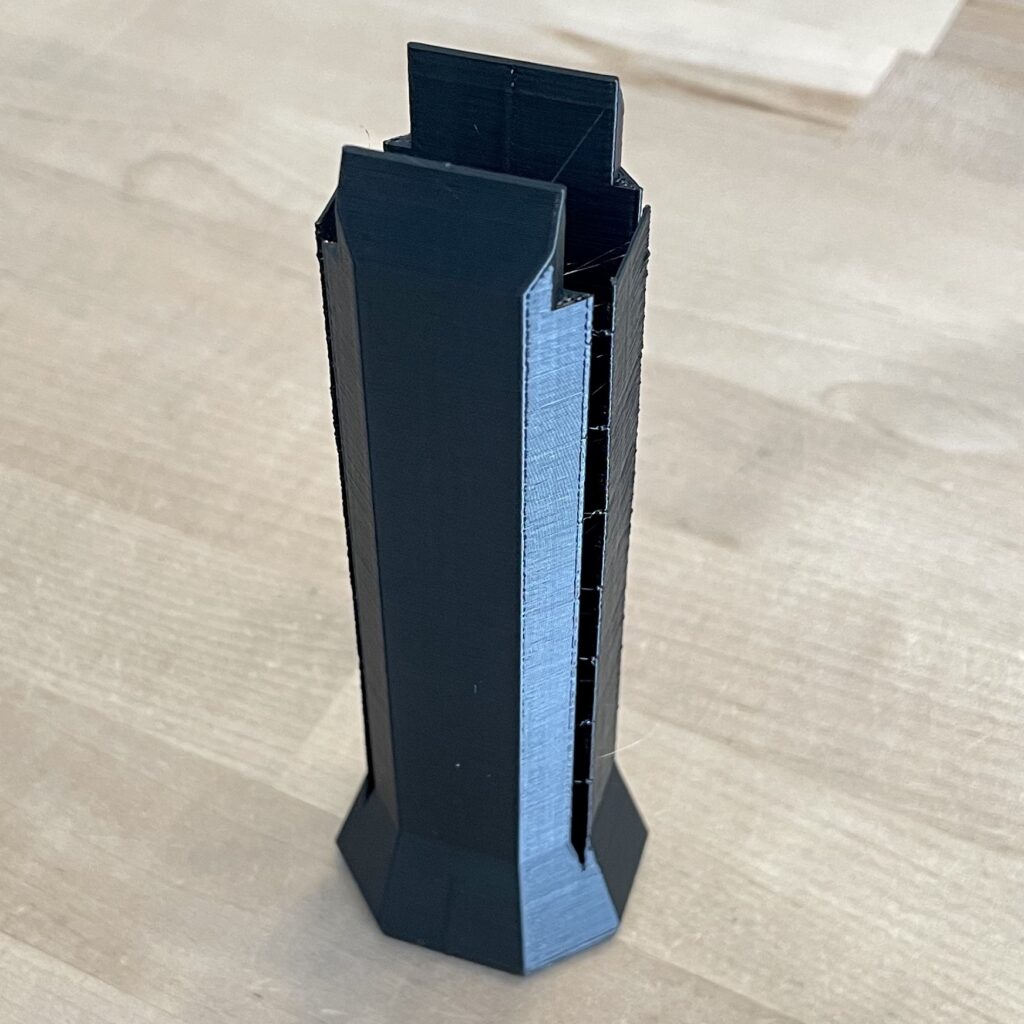
The handle is 31 mm wide, which is just under the corresponding 32.1 mm width of my target. The depth of this surface, at 16.24 mm due to the 16 mm core, is considerably larger though, so the corners exceed the outline of my target. I printed a handle like this.

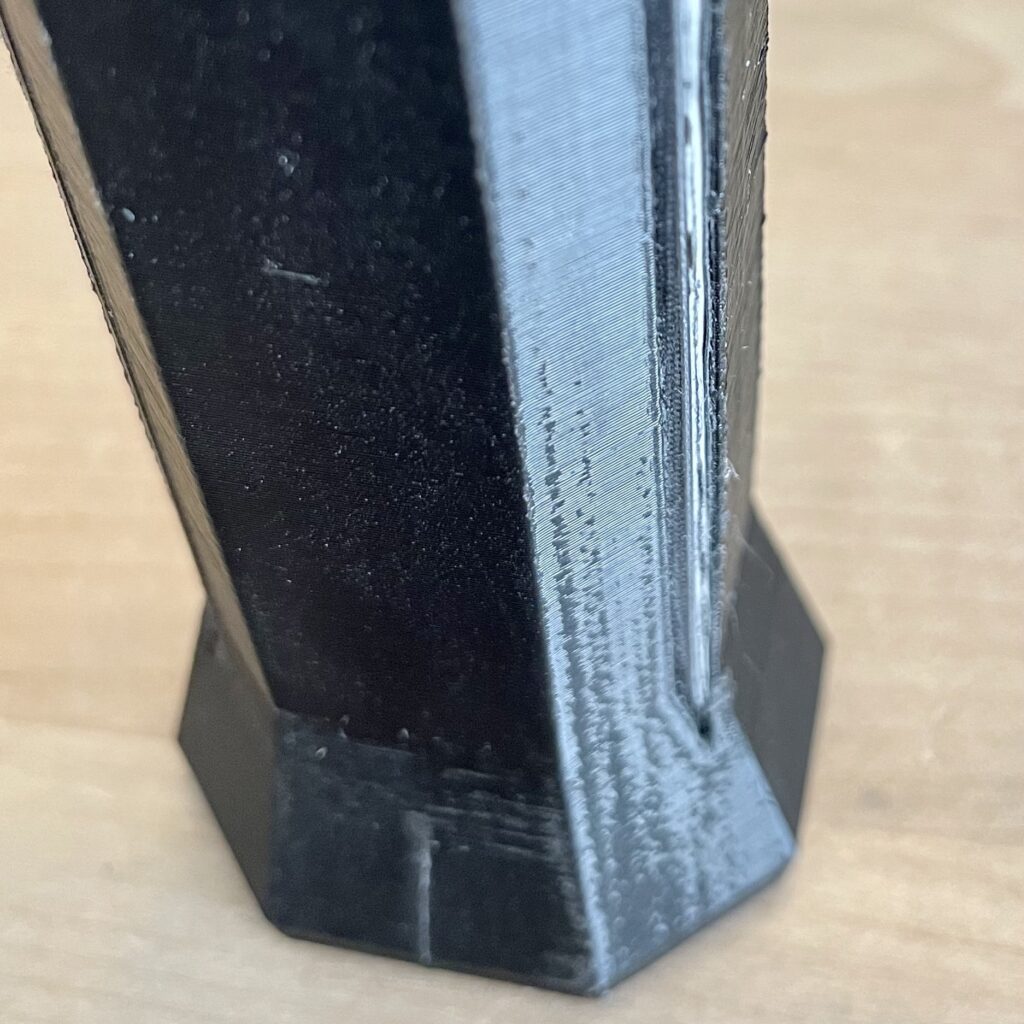
I used the handle as a guide to file down the corners of the paddle that stuck out.

I added double-sided tape to the handle faces and wrapped the handle tightly with more double-sided tape.

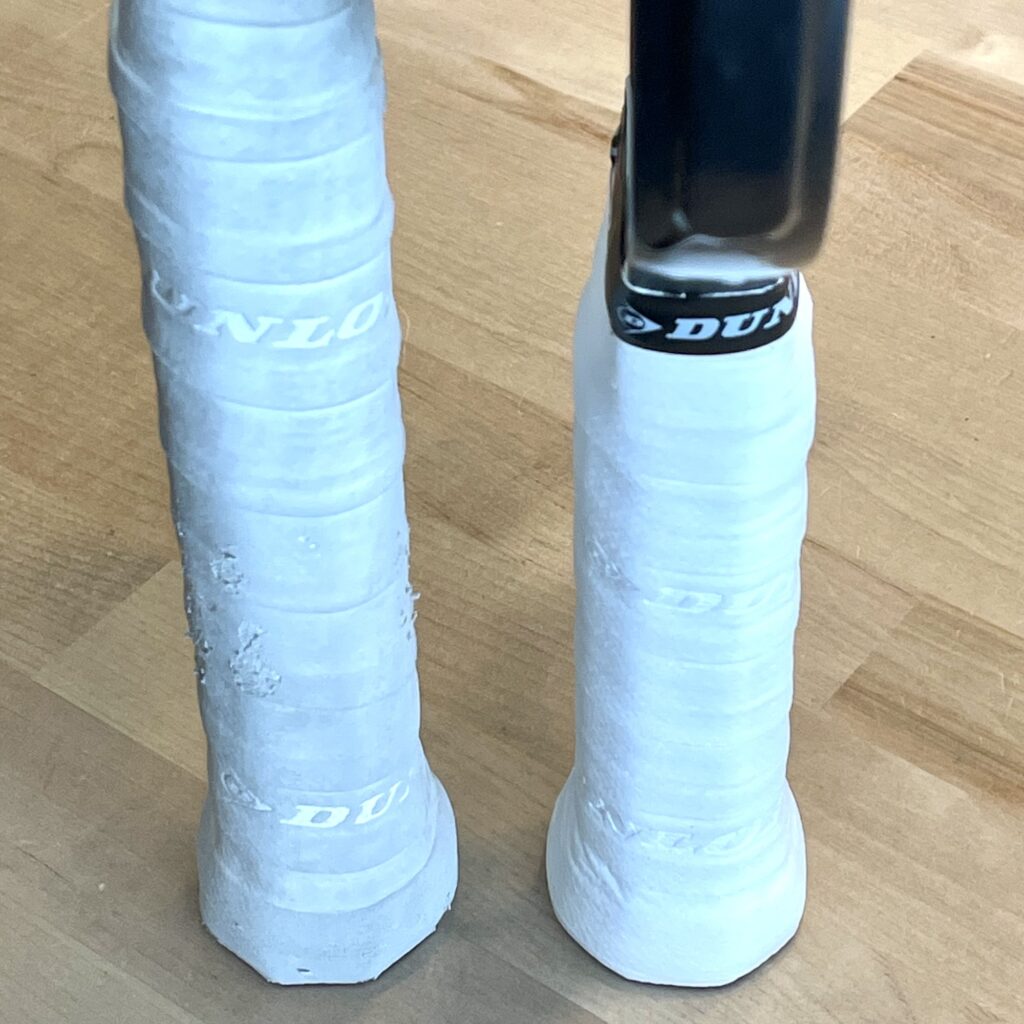
Here’s the result next to one of my racquets. They feel very similar in the hand. And yes, I know my racquet needs a new overgrip.

The printed handle is ~6 grams heavier than everything it replaced, though it could have been lighter. I opted for thicker walls for durability, as I didn’t think I’d mind the extra weight in the handle. Final specs with overgrip and ~13 g of lead just above the bottom shoulders (4 and 8 o’clock):

  • Weight: 252.5 g (8.9 oz)
  • Balance: 22.6 cm
  • Swingweight (5 cm): 115.7 kg·cm²
  • Twistweight: 6.93 kg·cm²
Posted on 1 Comment

Trying a Hard Case for the SW1

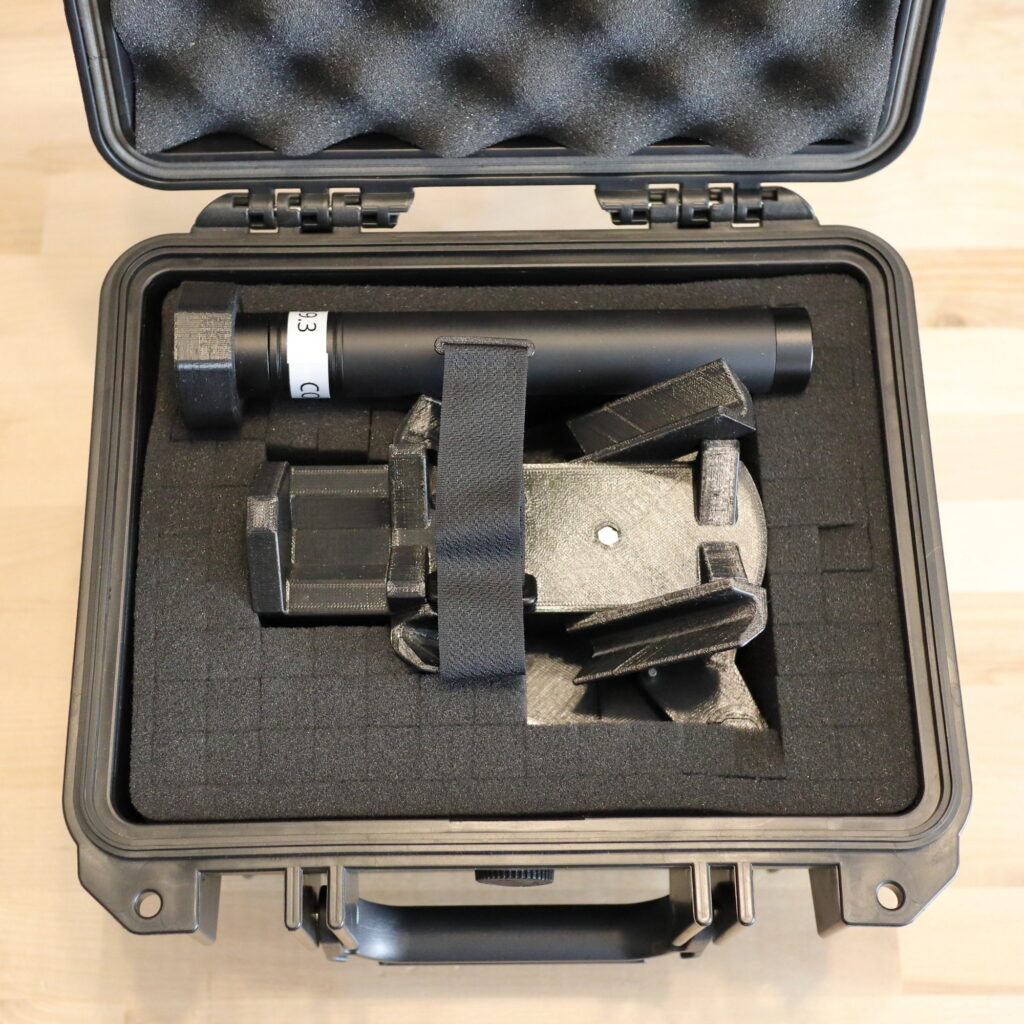
I recently purchased an inexpensive hard case to try with the SW1. It seems good enough to hand carry the SW1 with BBs installed, but I’d still remove the BBs for shipping or in checked luggage. It’s easy enough to dump them into a large zip-lock bag and re-fill from the bag.

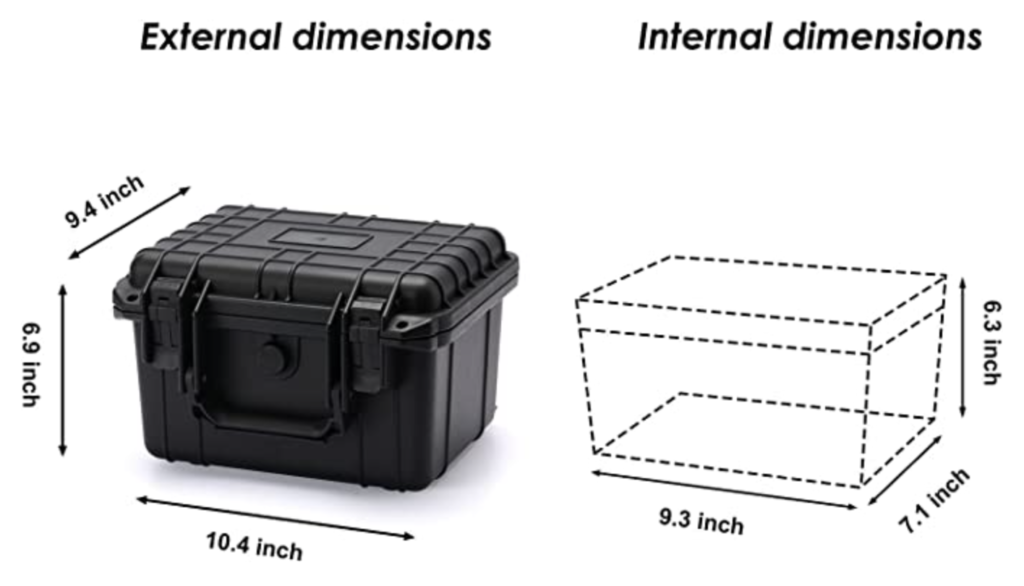
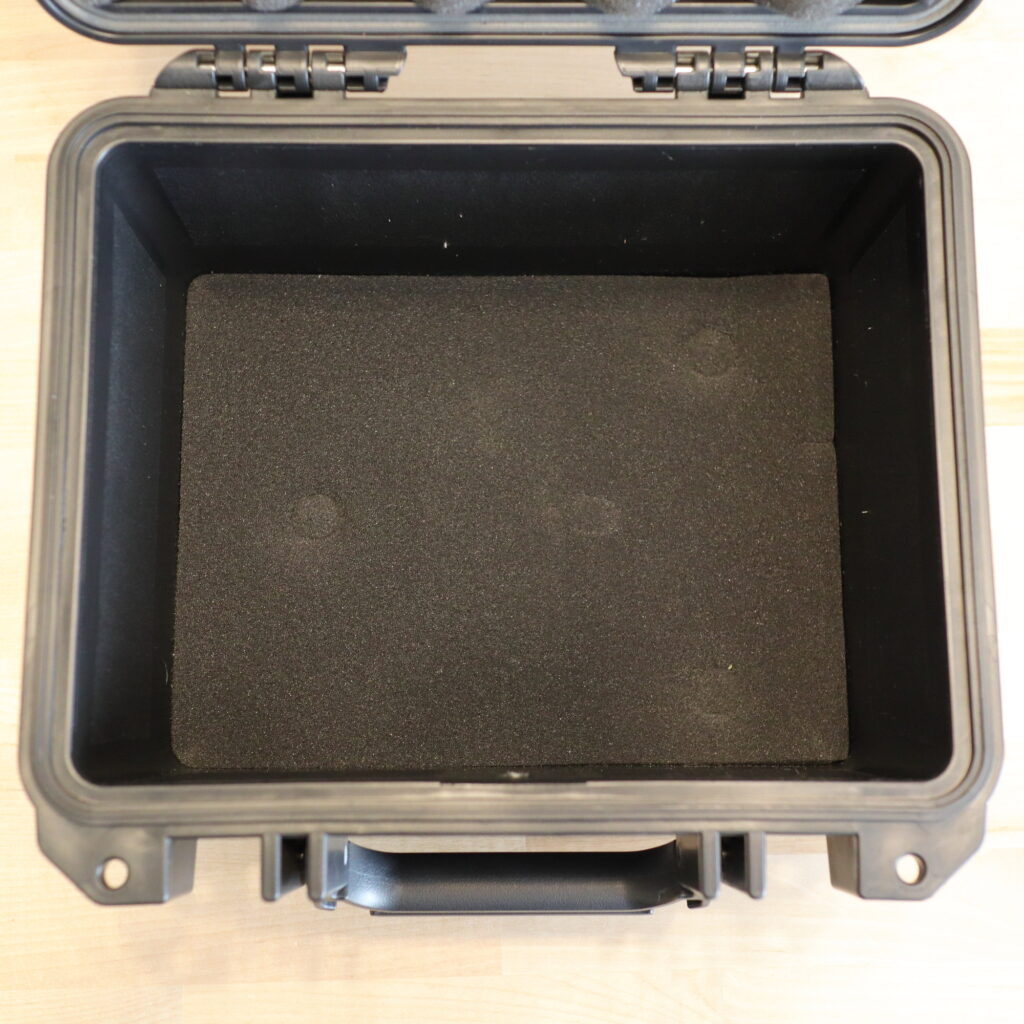
The case is branded Mayouko and was available on Amazon for $25.17. There were several others that looked to be identical. The listing shows internal dimensions of 9.3 x 7.1 x 6.3 inches. Those dimensions are accurate at the top, but it gets a bit smaller at the bottom.

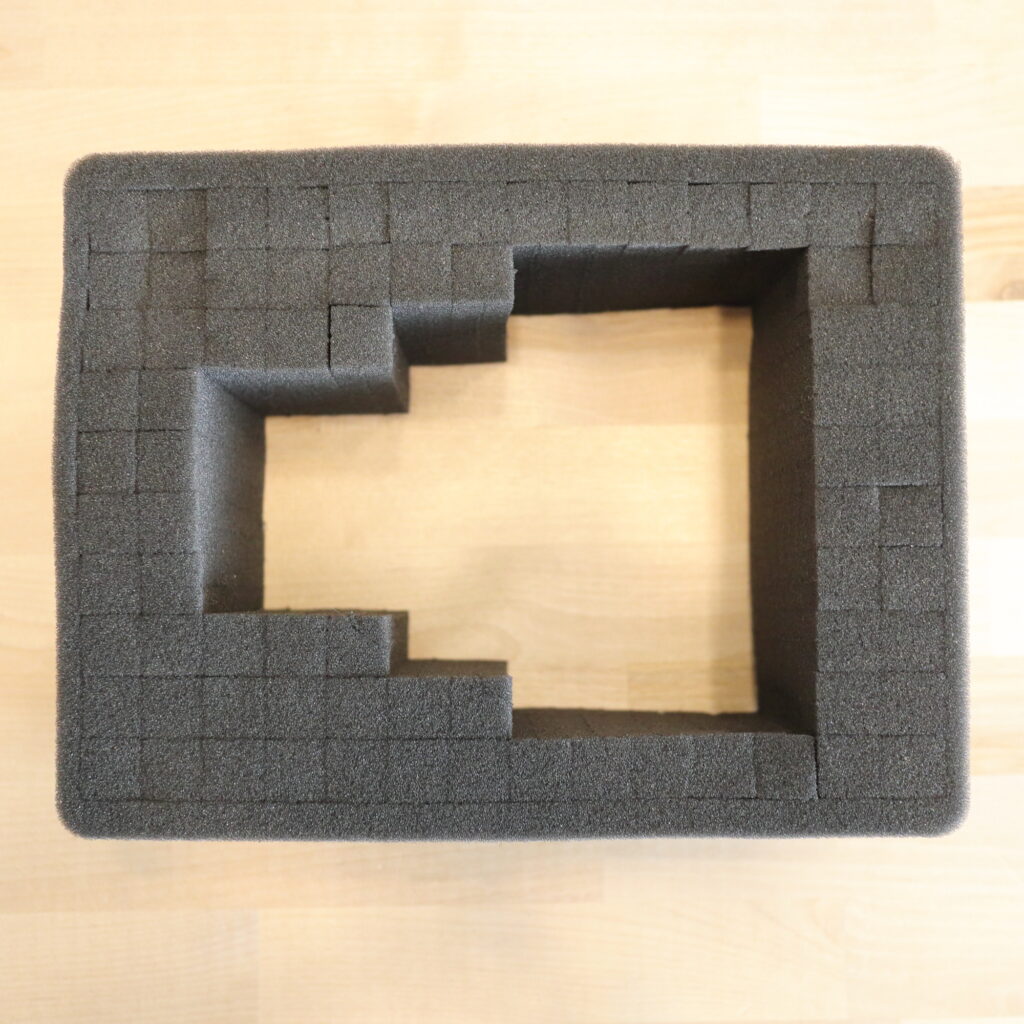
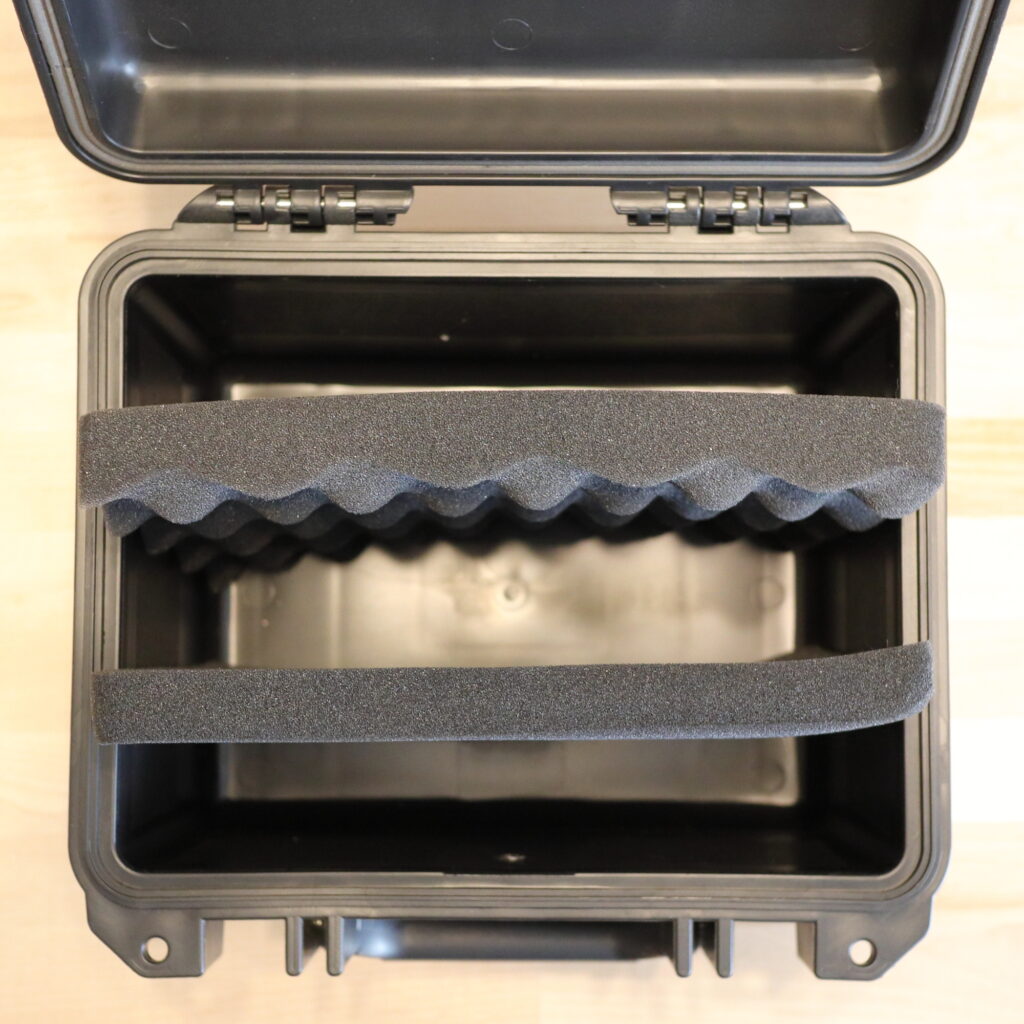
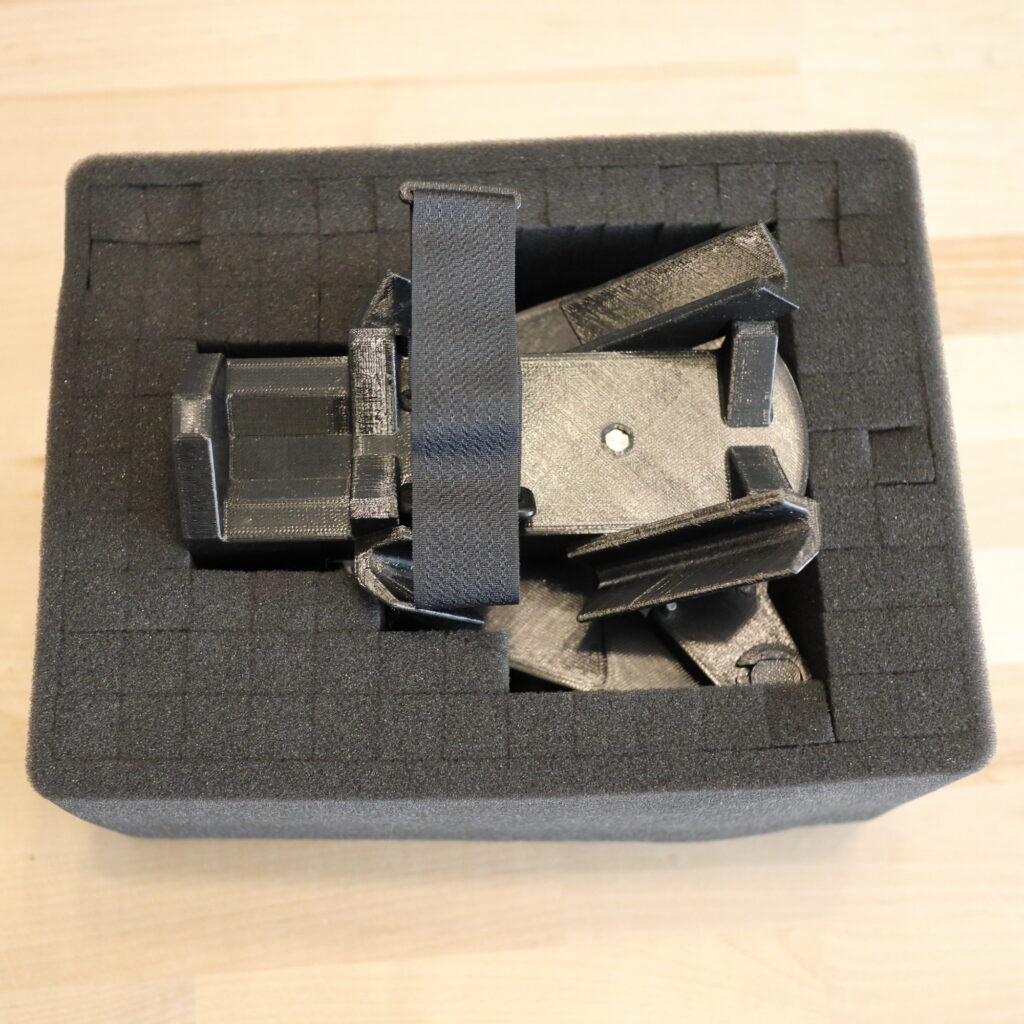
There are three pieces of foam included. The middle foam block has columns that can be easily removed. Here’s how I configured it for the SW1.

Here’s the SW1 loaded. There’s room for the extendable calibration rod just sitting on top of the foam.

There is good padding on the sides of the SW1, but it’s lacking on top and bottom. Here are the top and bottom pieces of foam.

The leveling feet of the SW1 compress the bottom foam, and there’s little support for the bottom of the SW1. For transport, it’s important to make sure the leveling feet are screwed in until they contact the base. Also, be sure to install the cradle support and cradle stop as they were in shipping.

It’s easiest to load the SW1 by placing the middle foam around the SW1 and the placing that into the case. Similarly, it’s easiest to unload the SW1 and foam together and then remove the foam.

Please leave a comment if you’ve found a better solution or have other ideas.

Posted on 2 Comments

SW1 Gets a New Calibration Rod

I’m pleased to announce that the SW1 includes a new calibration rod. The original PVC pipe calibration rod worked well, but it was inconvenient to pack and ship. The length of it required a large box with lots of void fill, and the dimensional weight of the box (used for some shipping pricing) was much higher than the actual weight. The reduction in shipping cost to customers within the US is slight, but it is significant to international customers. The new rod is also easier to transport and store.

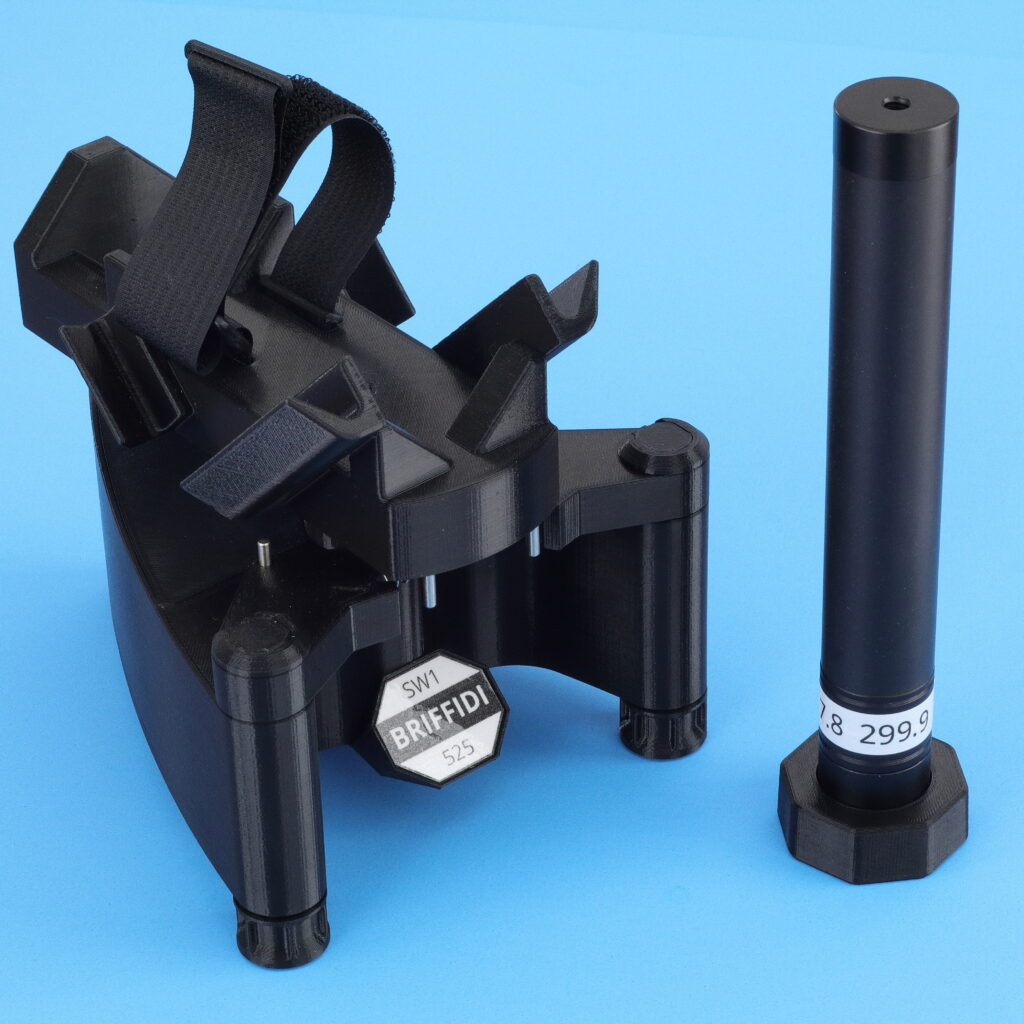
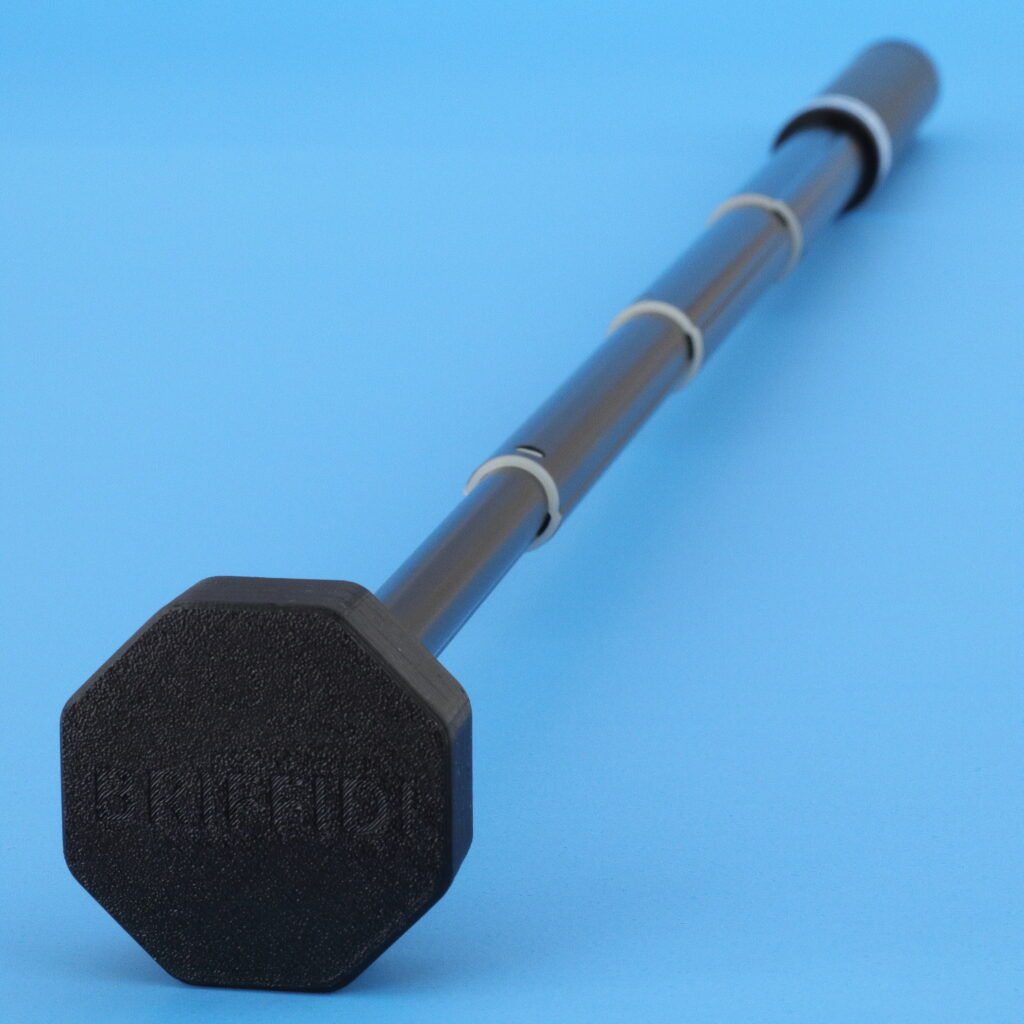
The new calibration rod is built upon an extension rod for camera equipment. A 3D-printed weight is permanently attached to the end to bring the swingweight of the extended rod up to approximately 300 kg·cm². When collapsed, it is under 8″ (20 cm) long, and extended, it is just over 29″ (74 cm) long. Each rod is individually measured, and the calibration values in the fully-collapsed and fully-extended states are printed on a wrap-around label.

Briffidi SW1 with CO2 Calibration Rod
CO2 Calibration Rod, Extended

The calibration values of the original calibration rods were calculated based on length and mass measurements of the components. For the new rods, calibration values must be determined from inertia measurements, which I originally avoided. However, to verify my length and mass measurements, I’ve been measuring calibration rods relative to my personal calibration rod for over a year. I’ve also better characterized the linearity of the SW1 and created new reference rods optimized for measuring the new rods. I’m now confident that I can produce accurate calibration rods based on inertia measurements.

Starting now, all SW1s will ship with the new calibration rod.

I realize that some people who ordered just before the switch may be disappointed. Rest assured that the original calibration rod works just as well to calibrate the SW1. However, for the next couple months, if you ordered an SW1 on November 1, 2022, or later, I will sell you a new calibration rod at a discounted price. Please contact me at support@briffidi.com if you’re interested.

Posted on Leave a comment

Dunlop Swingweight Machine Linearity Testing

Recently, I had the opportunity to test a Dunlop swingweight machine, so I measured the set of reference rods from the Briffidi SW1 Linearity Testing. I had previously seen data from an old Babolat RDC (Spurr) that showed significant non-linearity across the measurement range, but I expected the modern Dunlop machine to be better. The following data is from just one machine, and I hesitated to share it, but if I were any other tennis nerd without a competing product, I would have shared it without even thinking.

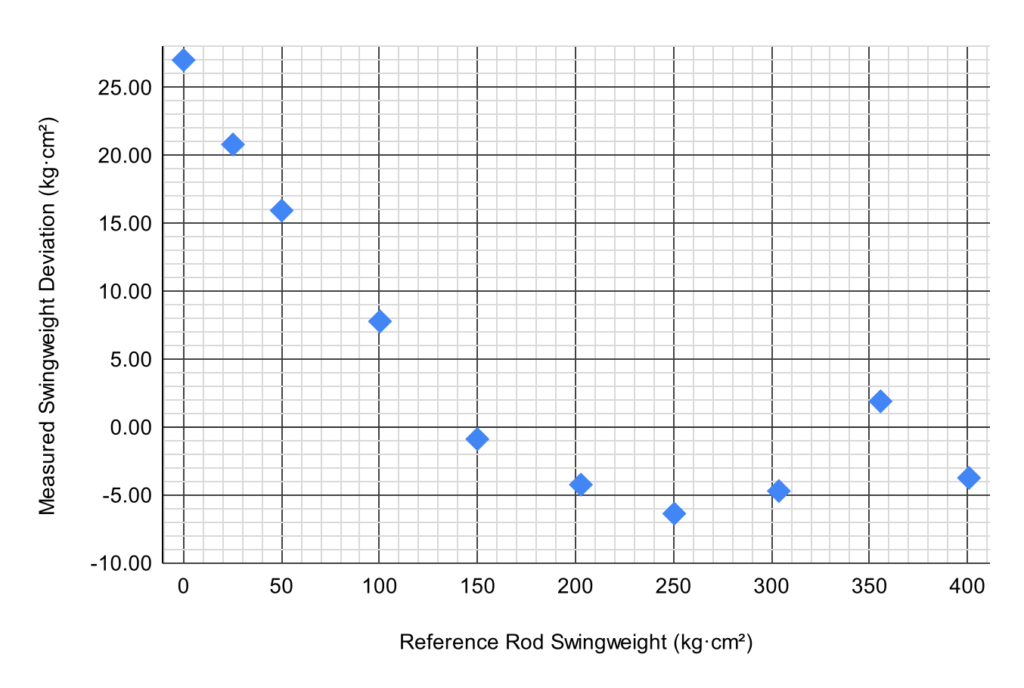
I verified that the Dunlop machine was calibrated and level. As describe in the SW1 testing, the reference rods were calculated from mass and length measurements. I measured the swingweight of each reference rod, in both orientations, on the Dunlop machine. The results are summarized in Table 1, and the deviation is plotted in Figure 1.

Calculated
(kg·cm²)
Mean Measured
(kg·cm²)
Deviation
(kg·cm²)
0.00 (empty)27.027.00
25.2146.020.79
50.0766.015.93
100.23108.07.77
149.89149.00.89
202.74198.5-4.24
250.37244.0-6.37
303.71299.0-4.71
355.61356.51.89
400.75397.0-3.75
Table 1 – Measurements of Reference Rods with Dunlop Machine
Figure 1 – Plot of Measured Swingweight Deviation by Reference Rod

Except for the outlier at ~400 kg·cm², there is a clear pattern to the deviation results. I don’t know enough about how the machine works to explain that outlier. The Dunlop calibration rod is marked 200±1 kg·cm², but there is significant deviation even there. It measured 204 kg·cm² on an SW1. There is both a shift due to the out-of-spec. calibration rod and significant non-linearity across the measurement range.

My goal is not to disparage the Dunlop machine, but I don’t mind pointing out that a big brand name or price tag doesn’t ensure greater accuracy. Even with the considerable inaccuracy, the Dunlop is still a useful tool. It looks and feels like a device you’d see in a professional setting, and the racket cradle is quite nice. Most importantly, it provided repeatable measurements, and that’s enough to match rackets. However, even at equal cost, I’d pick the SW1, as the accurate measurements (along with my spreadsheet) usually allow me to hit my target specs on the first try.

Posted on Leave a comment

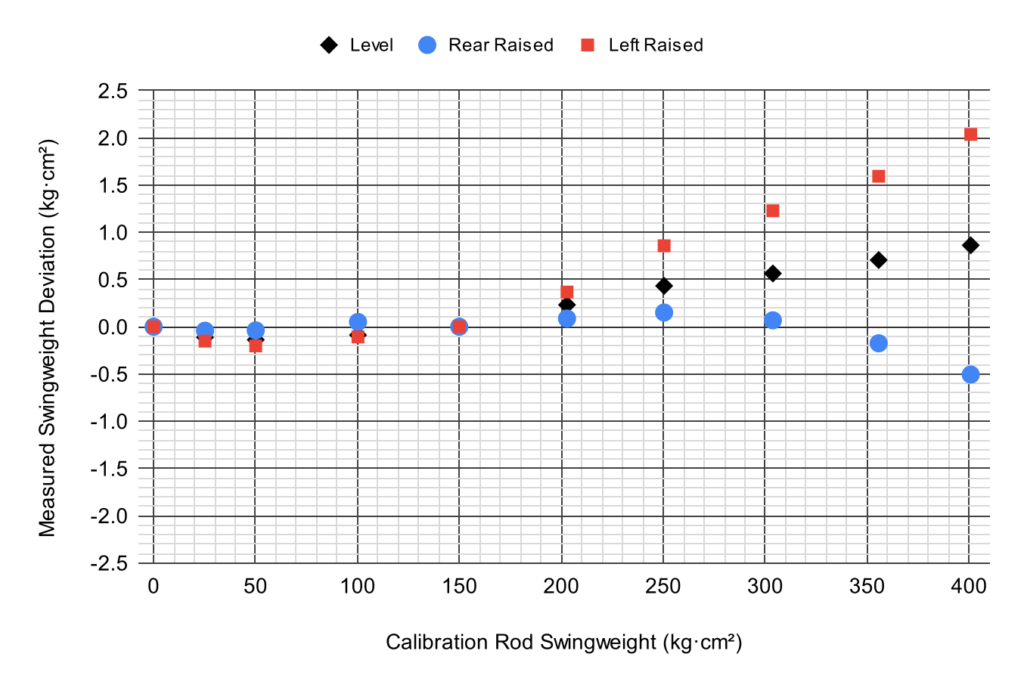
Effect of Leveling on Briffidi SW1 Measurements

I previously completed some linearity testing as described in Briffidi SW1 Linearity Testing, and I recently repeated the testing with the SW1 intentionally not level.

First, I leveled the device and then raised the rear foot by two turns (1 mm). I took measurements at ten points, as described in the prior post, except I reduced the number of measurements from five to two in each configuration, as five seemed like overkill. Then, I returned the rear foot to level and raised the left-side foot by two turns (1 mm), and repeated the testing.

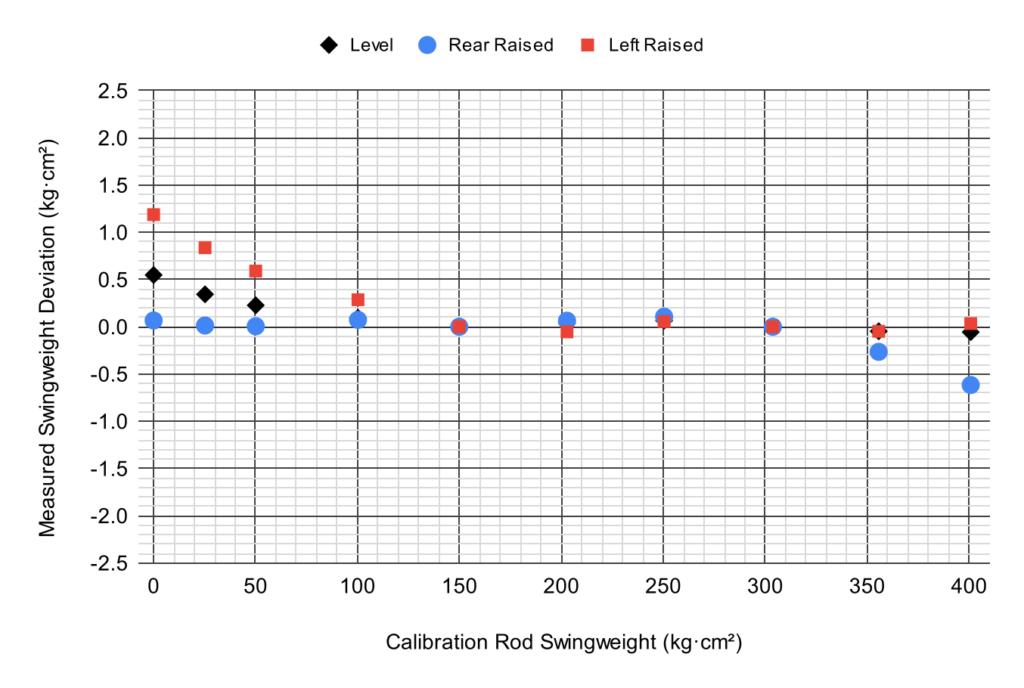
The plots below show the results of the prior, level testing and the two non-level configurations. For each, I calculated the calibration values in two ways. For Figure 1, similar to the standard calibration procedure, I used the measurements nearest to 150 and 300 kg·cm². For Figure 2, I used the measurements at zero (empty) and nearest to 150 kg·cm².

Figure 1 – Swingweight Deviations with 150 and 300 kg·cm² Calibration

With the standard calibration, using the measurements nearest to 150 and 300 kg·cm², the deviation is fairly small in the range of normal tennis rackets, regardless of leveling. With the rear raised, the effect of gravity is seen at higher swingweights. Gravity adds to the spring force and reduces the period of oscillation. With the left side raised, there is an effect at low swingweights that I don’t fully understand.

Figure 2 – Swingweight Deviations with 0 and 150 kg·cm² Calibration

With the 0 and 150 kg·cm² calibration, the non-linearity of the measurements is a bit more apparent. Raising the rear actually seemed to offset some of the non-linearity present when level. Raising the left side seemed to add to it.

My take-away is that for measuring typical tennis rackets, calibration does a good job of compensating for leveling error. If you’re going to calibrate after, it’s not necessary to spend much time leveling. If your surface is fairly level, it’s probably fine to just leave the leveling feet all-the-way in. Leveling would still be important if you wanted to move the SW1 and not re-calibrate, perhaps if you were taking the device somewhere without the calibration rod. If the device is level when calibrated and level after being moved, the measurements should be good.

Posted on

Briffidi SW1 Linearity Testing

Since finishing the Android app, I’ve gotten back to a couple of other developments. I mentioned a twistweight adapter in another blog post, and I’ve received some interest in measuring the swingweight of pickleball paddles. In both cases, the measurements are outside the range of typical tennis rackets. I had done some linearity testing when developing the SW1, so I was pretty confident about measuring pickleball paddles. However, the twistweight adapter requires measurements down in the single digits, so I decided to do some testing all the way down to zero.

I fabricated and measured PVC pipe calibration rods at targets of 25, 50, 100, 150, 200, 250, 300, 350, and 400 kg·cm². For all but the three longest pipes, I measured the length with the same calipers (0.002 cm resolution) and fixtures that I use for production, but for the longer pipes, I used a stainless steel meter stick with etched millimeter markings and an eye loupe to estimate to the nearest 0.01 cm. The swingweight of each rod was calculated from the formula for a thick-walled, cylindrical tube with open ends. I used an outside diameter of 3.34 cm, inside diameter of 2.66 cm, and a pivot axis 10 cm from the end. The measurements and resulting swingweight are summarized in Table A.

Figure 1 – Calibration Rods
Mass
(kg)
Length
(cm)
Swingweight
(kg·cm²)
0.00
0.1617534.72625.21
0.2047140.60050.07
0.2451748.882100.23
0.2626055.422149.89
0.2828160.522202.74
0.3231762.390250.37
0.3418765.86303.71
0.3578268.88355.61
0.3705271.27400.75
Table A – Calibration Rods

With an SW1, I took measurements empty and with each of the calibration rods. PVC pipe is not perfectly homogenous, so I measured each rod in both orientations. For each configuration, I recorded the oscillation period of five measurements and averaged the results. These results are summarized in Table B.

Swingweight
(kg·cm²)
Period A
(s)
Period B
(s)
Avg. Period
(s)
0.000.174970.17497
25.210.390430.390050.39024
50.070.522190.522240.52222
100.230.718420.718420.71842
149.890.870200.870300.87025
202.741.008401.006271.00734
250.371.116241.116811.11653
303.711.227931.226351.22714
355.611.323781.328151.32597
400.751.406481.406191.40634
Table B – Periods of Oscillation for Each Calibration Rod

For an oscillating, horizontal spring pendulum as used by the SW1 and most other swingweight machines, the moment of inertia of the system (racket plus oscillating portion of the machine) is proportional to the square of the oscillation period. Figure 2 is a plot of swingweight versus the square of the oscillation period. A linear trend line fits very well. For the curious, the slope and y-intercept of this line are the calibration results displayed at the bottom of the Calibrate page in the app. However, the line is fitted exactly through points at the two calibration values (around 150 and 300 kg·cm²), and the sign of the y-intercept is flipped.

Figure 2 – Swingweight by Square of Oscillation Period

Looking much more closely, Figure 3 shows the deviation of the measured swingweight from the calculated swingweight of each calibration rod. The results of the fitted trend line in Figure 2 are used to calculate the swingweight from the period of oscillation. The first thing to notice is that the largest deviation is only 0.21 kg·cm². Second, the deviation doesn’t look entirely random. I would need to repeat this testing to see if this pattern persists. If it isn’t random, perhaps friction is causing the deviation to increase near zero. I’m not sure what else would cause such a pattern, but please leave a comment below if you have an idea.

Figure 3 – Deviation by Calibration Rod

When designing the SW1, I calculated the torque deviation introduced by using a linear spring to drive a rotating pendulum. I considered other designs, such as a spiral spring or using a drum and cables to convert linear spring force into torque. In the end, I chose to stick with a simple spring drive but oscillate through a smaller arc than other swingweight machines I’ve seen, as this kept the deviation below 1% at the extremes of travel.

How do these results compare to other swingweight machines? The only similar data I’ve been able to find is from an old Babolat RDC, and it was quite non-linear. I expect that modern machines are better, but I don’t know. I’d be happy to test that. If you’re in the DFW area and have another swingweight machine that I could use for testing, please send me a message at support@briffidi.com.

So, what did I learn?

  • The SW1 is very linear from zero to 400 kg·cm² and presumably beyond.
  • It’s capable of measuring twistweight very precisely and accurately with the adapter I’m developing.
  • It’s suitable for measuring pickleball paddles (with a suitable adapter for mounting the paddle).
  • It’s reasonable to calibrate the SW1 with a single calibration object. Did you lose the calibration weight for your SW1? I can replace it, but you could also set the calibration “Object #1” value to zero and take measurements for the first and last groups with only your phone in the cradle. Absolute accuracy may suffer slightly, but using these data and calibrating with the zero and 149.89 kg·cm² measurements, the deviation at 400.75 kg·cm² is still only 0.86 kg·cm².